 Live Chat
What Is a Data Scientist and What Do They Do?

If you’re considering a role in data science, your job prospects couldn’t look rosier. For four straight years, “Data Scientist” held the top spot on Glassdoor’s annual list of the 50 best jobs in America, and only lost its crowning title this year. In 2020, it still ranks as the third-best occupation in the country, falling just behind careers in Front End Engineering and Java Development. Job satisfaction isn’t all that shabby, either — Glassdoor notes that data scientists enjoy a remarkably high rate of career satisfaction, holding four out of five possible stars in their rating.
But what is a data scientist? What do data scientists do — and why do they love their jobs so much?
As their title suggests, data scientists make sense of data. Their role is to clean, organize, sort and analyze collected information to discover insights, patterns or trends that can help businesses make better strategic decisions.
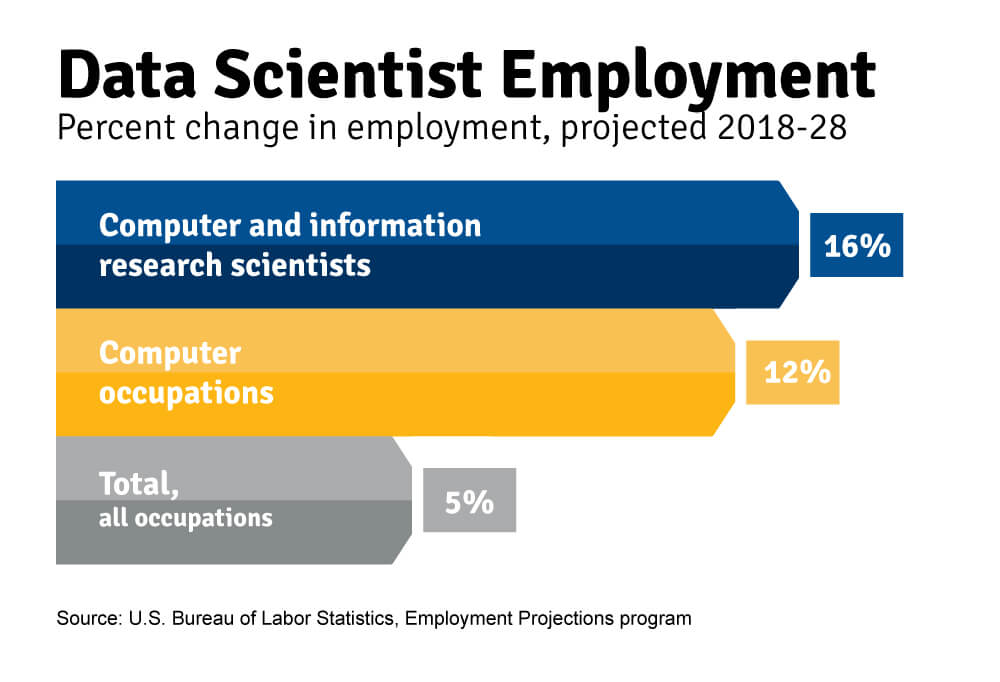
It’s a highly specialized role, one that has risen to the forefront of demand as companies of all sizes increasingly rely on data and the business insights it provides. According to data published by the Bureau of Labor and Statistics, the employment of data scientists is expected to rise a full 16 percent between 2018 and 2028. This growth is significantly faster-paced than the average growth for all occupations, which rests at around 5 percent.
 Moreover, because demand currently outpaces supply for data scientists, negotiating power rests firmly in the data scientists’ hands. This intense need for talented professionals all but characterizes the industry — but interestingly, the hiring frenzy is a relatively new development.
“One little-known fact is that as of 2015, there was (gasp) a national surplus of Data Scientists – can you believe it?” data scientist Jen DuBois wrote in a 2019 QuantHub article. “Believe it or not, employers in big cities like Atlanta had their choice of Data Scientist candidates… But after 2014, large companies in all industries began ramping up their big data analytics and data science.”
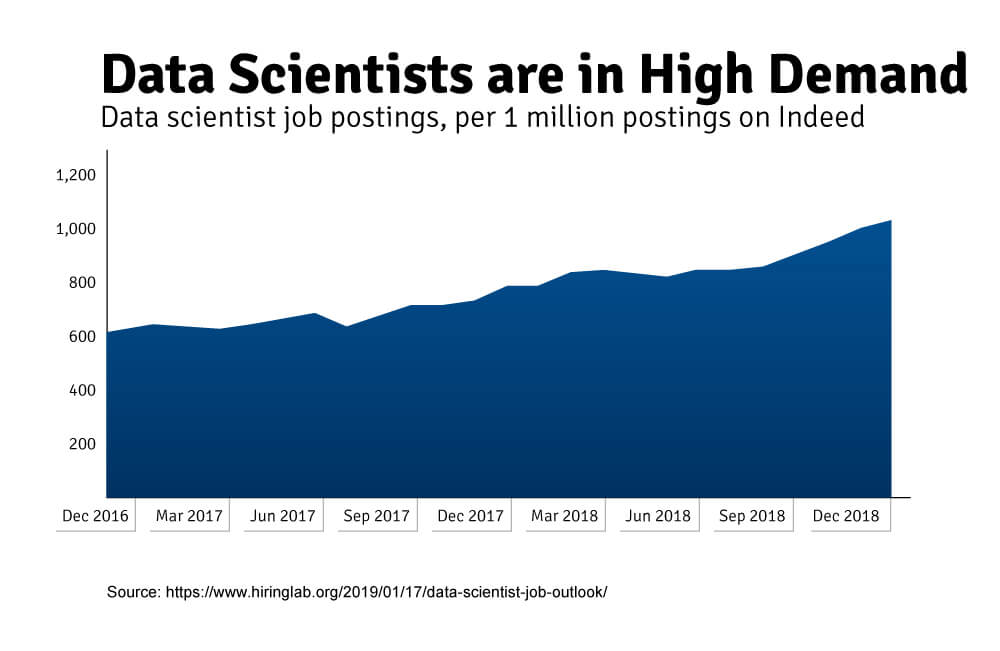
It’s true. According to the Indeed Hiring Lab, the number of job postings for data scientists has increased by a whopping 256 percent since 2013. But why are these professionals so necessary? What does a data scientist do?
What Does a Data Scientist Do?
A data scientist’s role centers on collecting, cleaning and analyzing data to distill valuable business insights that can be used to improve company decision-making. Their usual responsibilities include gathering and processing consumer and market data, building infrastructure to hold and organize accumulated information and presenting analyses to company decision-makers in an easy-to-understand way. Everyday tasks also include building dashboards, writing reports, visualizing data and cleaning and processing information.
The last is particularly important; there’s an old truism that data scientists spend 80 percent of their time cleaning and collecting data and only 20 percent performing actual analysis. Without a clean, organized data set, data scientists run the risk of unearthing misleading patterns and mistaken conclusions. While that remains true to this day, researchers at IBM note that the organizational component may lessen as AI automation incorporates further into the data science field.
In an interview summary for the Harvard Business Review, data scientist Jonathan Nolis divides the data scientist role into three major categories: business intelligence, decision science and machine learning. Let’s break these down.
Business Intelligence: Data scientists in this category focus on using the information a company already has to create actionable insights and present them to consumers, team members in other departments or other non-data-specialist audiences in the form of readily understood reports and presentations.
Decision Science: As the name suggests, decision science is all about distilling findings and sharing data-driven business insights with company decision makers who can use them to shape business strategy.
Machine Learning: With machine learning, data scientists strive to create data models and put them into autonomous, continuous production for project goals or information gathering.
Most data scientists weave aspects of all three categories into their role; however, some may have a heavier or lighter focus on one of the areas than their peers.
A Day in the Life
Now that we’ve laid out context for the role, let’s start looking into what data scientists do on a daily basis. Below, we’ve outlined the six significant tasks that all data scientists take on in their daily to-do lists regardless of their “category” or industry.
Data Mining
Data mining is, essentially, exactly what it sounds like. During this process, a data scientist “digs” through data, looking for patterns, trends or other useful insights. That’s a sizeable task when you consider the amount of information that, let’s say, a bank or e-retailer collects about its customers. Even small organizations collect a significant amount of information on a daily basis. Effective data mining cuts through all the unnecessary “white noise” in these data sets and allows real insights to emerge.
This process has evolved rapidly over the past 20 or so years; initially, data scientists needed to spend a significant amount of time and energy culling information from databases. Today, with improved AI, the process is much more efficient. That said, the task still requires an understanding of statistics, machine learning and artificial intelligence. Proper data mining is the foundation of good data science — after all, data scientists can’t present their clients with relevant analysis without making the appropriate queries!
Data Cleaning
Not all data sets provide equal value. When left in a data set, outdated, irrelevant or corrupted data can irreparably compromise a data scientist’s analysis and lead them to faulty conclusions. As you might expect, this mistake can be highly detrimental to companies that rely on such analysis to make business decisions. For clients, too, clean data is crucial. If a company is measuring the results of a recent product launch, they don’t want long-ago, irrelevant data to be included in their present-day analysis. Great data scientists strive to ensure that the data they use is accurate, relevant and uncorrupted.
Today, a lot of the cleansing and correction of data can be done using software programs. However, someone knowledgeable still needs to keep an eye on that phase of the project, as manual processing or correction of data can be necessary at times. Having clean data can make the difference between creating a high-quality analytical report and one that leads readers to incorrect conclusions.
Interpreting Patterns to Identify Solutions and Opportunities
Once data has been processed, data scientists begin scrutinizing the patterns and trends that they identified in earlier stages. What do they signify? Why and how are they occurring? What about outliers? What are the factors driving these patterns? This phase of the job is essentially an expansion on data mining principles; it’s more refined, but it’s the same basic process.
Patterns are crucial in data analysis. Consider a retail business as an example; a retail company needs to understand consumer behavior and purchasing patterns. Once they do, they can try to fine-tune their offerings and procedures to make it easier for customers to spend more on the goods that they like. Similarly, banks need to know which customers use which services. Can they create bundles that make it more attractive for more customers to open more accounts? If analyses indicate that doing so would suit current consumer needs and decision-making, then offering bundles might be worth considering.
Data-driven analyses like these help businesses in all industries develop a better understanding of their consumer base and develop optimized strategies — none of which could be accomplished without the help of talented data scientists.
Relaying Findings to Stakeholders
Once data scientists identify and interpret patterns or trends, they need to communicate their analyses to their intended audience. This can be the most crucial and challenging part of a data scientist’s job, especially given that the people that data scientists present information to are often executives, marketing professionals and others who have a limited data science background. They are unlikely to understand the nuances of advanced statistical methods — or want to endure an overly technical explanation of the process. Data scientists need to relay their conclusions in a way that is accessible and understandable to a non-technical audience.
One of the best ways to make analytical conclusions digestible is to visualize them via graphics and illustrations. Statistics tend to be much easier to grasp when plotted on a graph, as the visual medium makes clusters and outliers readily visible. It’s also easy to circle, highlight or write notes next to these graphics during a live presentation. Data visualization has come a long way in recent years; today, it’s possible to create animated graphics that show the evolution of trends and patterns over time. Illustrations and charts should always be tailored to the expertise of the audience. After all — the idea is to communicate with them, not overwhelm them with your scientific prowess.
Data Managing
Data management is one thread that runs through all of these processes. Data management refers to a data scientist’s efforts to effectively collect, store, clean and process data. Our growing reliance on digital solutions has made it necessary for companies to store and handle ever-larger sets of data. Understanding the best way to warehouse and manage that data is a crucial skill for capable data scientists — without it, even mining data can be challenging.
Tools Data Analysts Use Regularly
Now you have a better idea of what data scientists do and why, but we have one important question left to answer: How do they do it? These are some of the tools that capable data analysts use regularly.
- Excel: Microsoft Excel may seem basic, but it’s a versatile program and an excellent tool for data scientists. It’s useful for organizing and editing tables of data, creating graphs and sharing that info with non-specialist clients.
- Python: Dating back to the 1980s, Python is a programming language that is beloved by data scientists. Not only is it easy to use with a straightforward syntax, it also maintains a large collection of open-source libraries that empower data analysts to manage, assess and apply their data easily.
- R: R offers a versatile and flexible environment for handling statistics and creating graphics. Data scientists can use this suite to produce high-quality graphics and perform advanced statistical analyses.
- Tableau: Tableau is an accessible data visualization and analysis tool that provides real-time data analysis and graphics. Among other functions, it can be used to create layperson-friendly dashboards and spreadsheets.
- SQL: SQL is an acronym for Structured Query Language and is the standard language used to query relational databases. Though SQL dates back to the 1970s, it remains one of the most-used languages in modern data science.
- Machine Learning: Machine learning is a subfield of artificial intelligence that overlaps with data analysis. Data scientists who specialize in machine learning automate analytical models and ensure that digital systems can independently identify patterns, draw conclusions from data and make decisions without constant human guidance.
- JavaScript: JavaScript is one of the foundational programming languages for working on the web. This is a program that makes it possible to add animation and other special non-text features to web pages. This feature, along with its easy usability, makes it an invaluable tool for data visualization and sharing the conclusions gleaned from data analysis.
Data scientists possess some of the most essential and in-demand jobs in the technology field today. If you have excellent communication skills and an aptitude for analysis, this might be the career for you!
Now that you know what a data scientist does, what will you do? If you’re interested in breaking into data science, take the time to explore your educational options. You never know; making a career change might not be as out of reach as you think.